
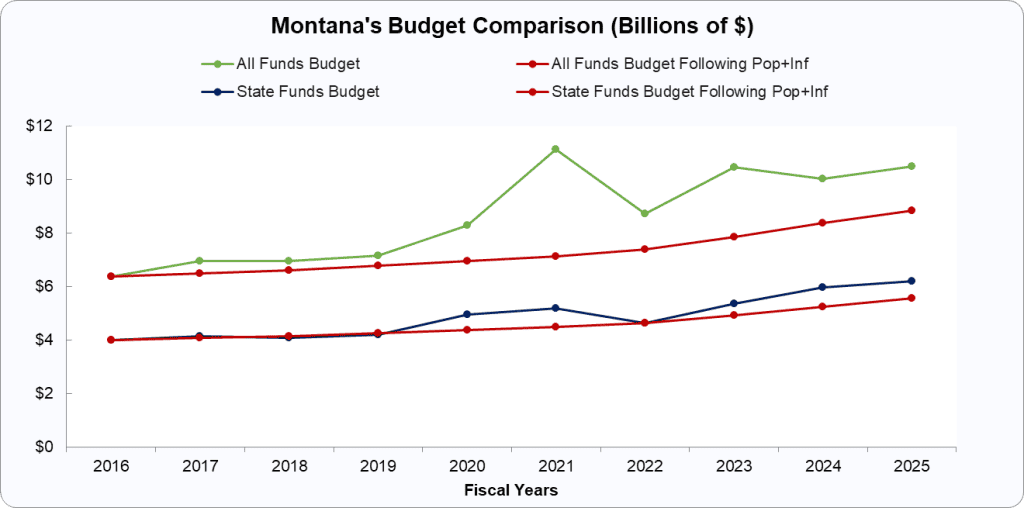
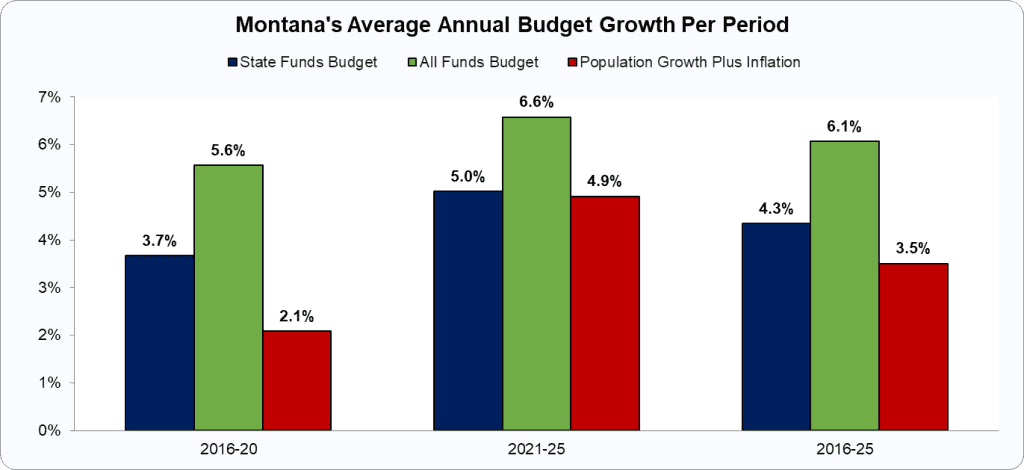
Montana’s budget increased cumulatively more than the maximum rate of population growth plus inflation in state funds and in all funds from 2016-25, meaning taxes are higher in state funds and in all funds than the average taxpayer can afford. These funds may not represent total spending in the state, as the data are based on NASBO data, as noted in the Methodology section.
- The 2025 state funds budget is $649 million higher than it would have been had spending grown at the rate of population growth plus inflation over the past decade.
- Because the state funds budget grew faster than population growth plus inflation for the last ten years, the state spent $3.0 billion too much.
- The 2025 all funds budget is $1.7 billion higher than it would have been had spending grown at the rate of population growth plus inflation over the past decade.
- Because the all funds budget grew faster than population growth plus inflation over the past decade, the state spent $13.8 billion too much.
State Funds Budget Data
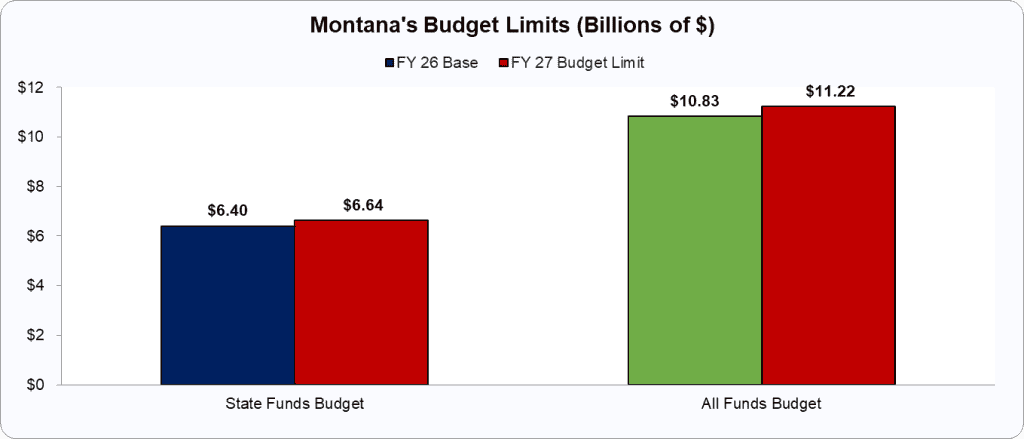
- Estimated FY 2026 Only State Funds Budget ($ Billions): $ 6.40
- FY 2027 Only State Funds Budget Limit ($ Billions): $ 6.64
- FY 2027 Only State Funds Budget Limit Growth (%): 3.66%
- Cost per person of only state funds budgeting more than pop+inf over the last decade in 2025 budget: $ 1,543
- Cost per family of 4 of only state funds budgeting more than pop+inf over the last decade in 2025 budget: $ 567
- Cumulative cost per person of only state funds budgeting more than pop+inf over the last decade from 2016-25: $ 2,608
- Cumulative cost per family of 4 of only state funds budgeting more than pop+inf over the last decade from 2016-25: $ 10,431
All Funds Budget Data
- Estimated FY 2026 All Funds Budget ($ Billions): $ 10.83
- FY 2027 All Funds Budget Limit ($ Billions): $ 11.22
- FY 2027 All Funds Budget Limit Growth (%): 3.7%
- Cost per person of all funds budgeting more than pop+inf over the last decade in 2025 budget: $ 2,455
- Cost per family of 4 of all funds budgeting more than pop+inf over the last decade in 2025 budget: $ 1,446
- Cumulative cost per person of all funds budgeting more than pop+inf over the last decade from 2016-25: $ 12,071
- Cumulative cost per family of 4 of all funds budgeting more than pop+inf over the last decade from 2016-25: $ 48,283
Other Economic and Fiscal Considerations
- Economic Freedom of North America (2023) (Rank): 23 [Fraser Institute]
- Economic Freedom (2022) (Rank): 29 [Cato Institute]
- Fiscal Policy (2022) (Rank): 19 [Cato Institute]
- Regulatory Policy (2022) (Rank): 35 [Cato Institute]
- State Tax Collections Per Capita (FY2021) ($): $3,514 [Tax Foundation]
- State Tax Collections Per Capita (FY2021) (Rank): 27 [Tax Foundation]
- State-Local Total Tax Burden per Capita (2022) ($): $5,795 [Tax Foundation]
- State-Local Tax Burden per Capita (2022) (%): 10.5% [Tax Foundation]
- State-Local Tax Burden per Capita (2022) (Rank): 27 [Tax Foundation]
- Top Income Tax Rate (2026) (%): 5.7% [Tax Foundation]
- Top Income Tax Rate (2026) (Rank): 33 [Tax Foundation]
- Flat/Progressive/Zero Income Tax (2026): P [Tax Foundation]
- Overall State Tax Competitiveness Index (2026) (Rank): 6 [Tax Foundation]
- Top Corporate Income Tax Rate (2026) (%): 6.8% [Tax Foundation]
- State-Local Sales Tax Rate (2026) (%): 0.0% [Tax Foundation]
- State-Local Sales Tax Rate (2026) (Rank): 3 [Tax Foundation]
- Property Taxes Paid as a Percentage of Owner-Occupied Housing Value (2023) (%): 0.8% [Tax Foundation]
- Property Taxes Paid as a Percentage of Owner-Occupied Housing Value (2026) (Rank): 17 [Tax Foundation]
- Economic Outlook (2025) (Rank): 35 [American Legislative Exchange Council]
- Economic Performance Rankings, 2013-2023 (2025) (Rank): 14 [American Legislative Exchange Council]
- Value for Tax and Expenditure Limits (0-3): 0 [American Legislative Exchange Council]
- Tax and Expenditure Limit (Rank): 32 [American Legislative Exchange Council]
- Right-to-Work Law (2025) (Y/N): N [American Legislative Exchange Council]
- State Spending per Capita (2022) ($): $ 7,227 [US Government Spending]
- State Spending per Capita (2022) (Rank): 26 [US Government Spending]
- Local Spending per Capita (2022) ($): $ 4,485 [US Government Spending]
- Local Spending per Capita (2022) (Rank): 8 [US Government Spending]
- Official Poverty Rate (2022-24) (%): 8.7 [Census Bureau]
- Official Poverty Rate (2022-24) (Rank): 17 [Census Bureau]
- Supplemental Poverty Rate (2022-24) (%): 14.3 [Census Bureau]
- Supplemental Poverty Rate (2022-24) (Rank): 43 [Census Bureau]
- Labor Force Participation Rate (Dec 2025) (%): 62.4% [Bureau of Labor Statistics]
- Labor Force Participation Rate (Dec 2025) (Rank): 29 [Bureau of Labor Statistics]
- Real Private Gross Domestic Product (2024) (Millions of $): $ 52,876 [Bureau of Economic Analysis]
- Real Private GDP (2024) (Rank): 46 [Bureau of Economic Analysis]
- Real Private GDP per Capita (2024): $ 46,482 [Bureau of Economic Analysis]
- Real Private GDP per Capita (2024) (Rank): 41 [Bureau of Economic Analysis]
- Real Private GDP Growth (2015-24) (%): 29.9% [US Bureau of Economic Analysis]
- Real Private GDP Growth (2015-24) (Rank): 15 [US Bureau of Economic Analysis]
