Overview
As Washington’s excessive spending pushes the national debt toward $40 trillion, several state governments show a better way.
In 2023, Americans for Tax Reform (ATR) launched the Sustainable Budget Project (SBP) to monitor how state budgets align with a simple, taxpayer-focused standard: limiting spending growth to the rate of population growth plus inflation (pop+inf). This benchmark reflects the average taxpayer’s ability to pay for government without being taxed into poverty or priced out of prosperity.
We’ve updated SBP data for every state through FY 2025 using data from the National Association of State Budget Officers (NASBO), provided new sustainable budget limits for FY 2027, and highlighted key economic and fiscal data and rankings. The budget data may not reflect a state’s total spending based on what NASBO includes in its database. For consistency, we have used these data for every state.
The findings illustrate that overspending, rather than under-taxation, is the primary issue in most states.
Spending Over The Past Decade: 2016–2025
Federal Government
- Federal spending skyrocketed 81.9% to $7.0 trillion in 2025, which is two and a half times faster than the 32.4% increase in population growth plus inflation. The average annual increase in the federal budget during the decade was 7.4% compared with population growth plus inflation of 3.0%. The first five years, from 2016 to 2020, saw an average annual budget increase of 13.3%, with a large part of that from the COVID-related spending in 2020, compared with just 1.9% for this key metric. But in the second five years, from 2021 to 2025, spending increased by 1.5% compared with 4.2% in this key metric.


- If Congress had simply restrained spending to the sustainable growth rate of population growth plus inflation:
- The federal government would’ve spent $1.9 trillion less in 2025.
- The national debt would’ve increased by less, with a $2.7 trillion increase instead of $15.6 trillion.
- Cumulative debt since 2006 would have risen by less, by $4.2 trillion rather than $23.2 trillion.
- That’s nearly $20 trillion in less deficit-spending that could’ve stayed in people’s pockets or been invested by the private sector to drive future prosperity, rather than siphoned off to often fund bloated bureaucracies, waste, fraud, and abuse.
State Government
- From 2016 to 25, aggregate state spending by the 50 state governments, excluding funds received from the federal government, increased by 65.8% during that decade to $2.1 trillion.
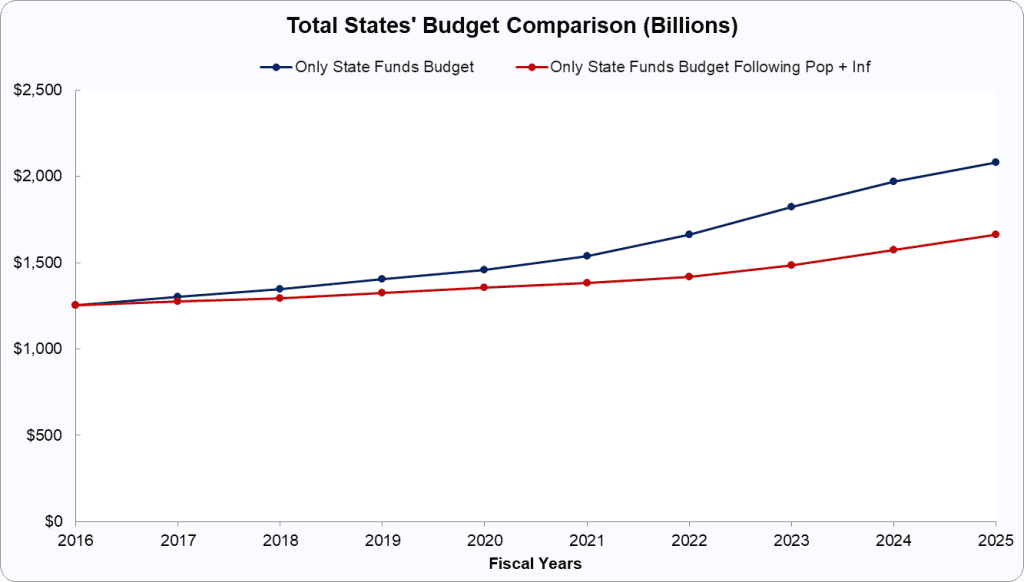
- Had states’ spending grown by the maximum rate of 32.4% in population growth plus inflation from 2016 to 2025, they:
- Would have spent $419 billion less in 2024.
- Would have had cumulative spending be $1.8 trillion less over that decade, leaving more money in people’s pockets.
- From 2016 to 2025, state spending increased at an average annual rate of 5.3%, exceeding population growth plus inflation of 3.0%. This is the result of some overspending (3.2% v. 1.9%) from 2016 to 2020, but substantial overspending (7.4% v. 4.2%) from 2021-25.

Budget Results
When combining federal and state overspending, Americans lost over $3.1 trillion in 2025 and more than $20.8 trillion in excess taxes and debt across the decade.
State Rankings: Who Spends Smart and Who Splurges?
Eight states kept their budgets below population growth plus inflation.
- Three states kept both state funds and all funds budget growth below pop+inf over the last decade:
- Colorado
- North Dakota
- Texas
- These states are the gold standard of sustainable budgeting—controlling both state funds and all funds spending, protecting taxpayers, and creating room for pro-growth tax reforms.
- Five more states kept state funds growth, but not all funds, below the benchmark:
- Iowa
- Louisiana
- Mississippi
- Ohio
- Oklahoma
- These states deserve credit for showing restraint with taxpayer-funded spending, even if their total spending (including federal funds) needs work.
No state kept total spending below pop+inf without also controlling state funds, which proves that sustainable budgeting begins with what states themselves control most.
Standout States: Fiscal Champions in State Funds from 2016-25
- Colorado (Blue State Politically)
- Cumulative Savings Per Average Family of Four: -$33,102
- Thanks to TABOR, Colorado remains a top fiscal performer—proof that constitutional spending limits work, even under Democratic control.
- North Dakota (Red)
- Cumulative Savings Per Family: -$80,262
- Low taxes, low spending, big growth. North Dakota continues to shine.
- Texas (Red)
- Cumulative Savings Per Family: -$10,262
- No income tax, budget restraint, and strong economic results. Enough said.
“Pro-Growth” States to Watch
- Florida (Red)
- Cumulative Cost Per Family: $11,037
- With 46.9% real GDP growth over the last decade, Florida demonstrates economic progress, but it needs to spend less to sustain that growth.
- Iowa (Red)
- Cumulative Savings Per Family: -$5,493
- Tax reform is promising, but spending needs to be reined in to ensure its sustainability.
- Louisiana (Red)
- Cumulative Savings Per Family: -$4,676
- A surprising bright spot: Louisiana’s state funds growth has stayed under control, but not for all funds.
- North Carolina (Red)
- Cumulative Cost Per Family: $6,023
- Strong growth, solid reforms. However, the budget is outpacing the average taxpayer’s ability to afford it.
- South Carolina (Red)
- Cumulative Cost Per Family:$17,927
- With 34.2% real GDP growth, the state must control spending to maintain competitiveness.
- Tennessee (Red)
- Cumulative Cost Per Family: $11,274
- No income tax and strong growth mask an emerging spending issue. Lawmakers should course-correct before it grows even more out of balance.
Worst Offenders: The Big Spenders
- California (Blue)
- Cumulative Cost Per Family: $56,991
- High taxes. High regulations. High departures from sustainable budgeting.
- Illinois (Blue)
- Cumulative Cost Per Family: $113,683
- A poster child for failed fiscal policy—overspending, debt, and a shrinking population.
- Minnesota (Blue)
- Cumulative Cost Per Family: $24,010
- Progressive budgets with regressive outcomes. Minnesotans deserve better.
- New Jersey (Blue)
- Cumulative Cost Per Family: $30,119
- High spending. High taxes. High cost of living. Low accountability.
- New York (Blue)
- Cumulative Cost Per Family: $20,121
- Losing people and capital thanks to decades of fiscal recklessness.
Conclusion: Let People Prosper, Not Government
When governments grow faster than the taxpayers’ budgets that fund them, something has to give—usually household budgets, jobs, or future opportunities. The solution is clear: reduce spending now and increase spending no more than population growth plus inflation at every level of government.
States like Colorado, North Dakota, and Texas prove this is possible. And if the federal government had followed suit, we’d have less debt, more growth, and stronger families. The path forward is simple—but it requires political courage. Reduce spending and impose a strict spending limit. Let people—not politicians—prosper.
Use the following map or dropdown menu to view detailed state-specific budget and economic information.
